Global Megathrust Earthquake Hazard—Maximum Magnitude Assessment Using Multi-Variate Machine Learning
 Andreas M. Schäfer
 Friedemann Wenzel
- Department of Physics, Geophysical Institute, Karlsruhe Institute of Technology, Karlsruhe, Germany
Megathrust subduction faults have caused the largest earthquakes ever recorded in human history. In addition, they are often associated with devastating tsunamis. Thus, assessing their potential maximum magnitude and respective return periods is vital for seismic-tsunami hazard assessment. However, empirical data are limited, owing to their very-long recurrence period that can be several centuries or millennia. To bridge this gap of empirical data with seismotectonic observations, a combined assessment of maximum magnitudes and return periods was undertaken applying a variety of machine learning and conventional methods. For this purpose, 76 subduction zone segments have been assessed worldwide. This includes a 3D modeling of subduction slab geometries on the basis of earthquake hypocenters and a collection of various relevant parameters e.g., those of local geology, geodesy or seismicity. These parameters have been used to assess the potential maximum magnitudes using machine learning classification and other statistical methods. The results have been combined with a tapered Gutenberg-Richter seismicity model and plate tectonic modeling to quantify earthquake return periods and their uncertainties. They show that almost all major subduction zones have the potential to produce earthquakes Mw ≥ 8.5 and that the maximum magnitude highly correlates with the subduction zone geometry. The results also highlight the potential of large megathrust earthquakes in regions where no large or significant events have been recorded during human written history. It is hoped that the results of this study support the development of tail-end hazard and risk studies for long return period events and the quantification of tsunami hazard and risk.
1. Introduction
Identifying the potential for very large earthquakes and their return periods has been a common research interest since the very beginning of earthquake science. Great megathrust earthquakes are of primary interest. They can be defined as the largest possible earthquakes of magnitudes Mw ≥ 8.0 occurring along large thrust faults, so-called megathrusts, always found along convergent plate boundaries. Thrust earthquakes are characterized by a major displacements which have the potential, depending on the event depth and overlaying surface topography, to cause large tsunamis as they have been observed in 2004 in the Indian Ocean, 2011 in Japan or several times in the last years around Chile.
The quantification of likelihood and potential for great earthquakes is a frequent but not yet well answered question (Geller et al., 2015) highlighted by the question to identify the largest possible magnitude Mmax at a fault. There are various, partially contradicting, opinions in the literature, where one is resolved by assessing the historic seismicity for a region (e.g., McCaffrey, 2008; Rong et al., 2014). On the other side, a parametric approach was used on the basis of physical characteristics (e.g., length, convergence rate, sediment thickness, etc.) of subduction zones or subduction zone segments which are correlated to identify physical threshold parameters beneficial for generation of megathrust earthquakes (e.g., Heuret et al., 2011; Schellart and Rawlinson, 2013).
In the light of developing a subduction zone parameter database, various studies have already previously assessed specific parameters, some of them on a global scale (e.g., Heuret et al., 2012; Schellart and Rawlinson, 2013) and many others on a local level (e.g., Suárez and Albini, 2009; Becker and Meier, 2010; Hayes and Furlong, 2010). For the development of a global database of subduction zone characteristics, it was important to also consider the early findings of Ruff and Kanamori (1980) or Peterson and Seno (1984), correlating maximum magnitudes with subduction speed and plate age, which had to be revised after the megathrust earthquakes in the 2000s (Stein and Okal, 2007).
One of the earliest parameter catalogs for subduction zones was published by Jarrard (1986) with 26 parameters identified for 39 subduction zones lining out several empirical relations which may control subduction processes. Lallemand et al. (2005) presented a study focusing on the relationships of such parameters to assess the influence of slab geometry on upper plate behavior including quantification of the down-going slab geometry. A very relevant study, in wake of the 2004 Indian Ocean tsunami, is of McCaffrey (2008) who indicated that any large subduction zone is sooner or later capable of producing Mw ≥ 9.0 earthquakes as long as the observation period is long enough.
Heuret et al. (2011, 2012) followed the lines of Lallemand et al. (2005), but with a focus on the seismic activity of subduction zones. They found various parameter relationships, including that the width of the Wadati-Benioff zone did not correlate with Mmax. Thus, the available area for seismic genesis did primarily not control the generation of large earthquakes historically. Scholz and Campos (2012) introduced a study about seismic coupling for various subduction zones along the Pacific. Schellart and Rawlinson (2013) analyzed 24 physical parameters of subduction zones considering 241 subduction zone segments. For each parameter, the range in which Mw ≥ 8.5 earthquakes occurred was identified. 6 parameters were shown as key drivers to generate large megathrust earthquakes. They are back-arc opening rate, trench migration speed, dip, subduction partitioning and 2 geometric curvature parameters. Based on those, a ranking was applied, which is increasing if the parameters of a subduction segment fall into the respective range, but extending it for Mw ≥ 8.0 earthquakes.
Rong et al. (2014) employed tapered Gutenberg-Richter models and seismic moment release rates to determine maximum earthquake magnitudes for various subduction zones based on Flinn-Engdahl regions (Flinn et al., 1974). Bletery et al. (2016) corroborated the hypothesis that subduction faults with low dip angle are more prone to very large earthquakes. They observed an even better correlation with the dip-angle gradient, the smaller the dip-angle gradient (i.e., the most planar) the largest the historical earthquakes. Their interpretation is that geometrical heterogeneities tend to stop rupture propagation, limiting the potential extent of earthquakes and therefore their magnitude. Van Rijsingen et al. (2018) describe a correlation of strong megathrust earthquakes and large features of subduction interface roughness. Thus, in contrast to more general conclusions (e.g., McCaffrey, 2008), a minimum set of boundary conditions may be required for large-scale rupture of Mw ≥ 9 earthquakes to be physically possible.
The question arises, summarizing the findings above, under what conditions large tsunami-genic and thus shallow interface earthquakes are possible along subduction megathrusts. Following-up on those studies, a rigorous combination of statistical analysis of earthquake activity combined with a parametric assessment of subduction zones can be considered a novelty and shown in this study. The advantage is given by the option that both methodologies can cross-validate each other. In case a subduction zone shows major potential both on the side of earthquake statistics and based on tectonic parameters, it is expected that it will produce major earthquakes and vice-versa. In case the results are more contradicting, a detailed discussion is necessary. Thus, regions with historic evidence help to identify potentials in other areas where big earthquakes haven't been observed before.
The concept applied in this study can be described as “trading space with time." It assumes that two regions which are similar in their physical characteristics show a similar behavior e.g., in seismicity. Thus, if the data record is incomplete for one of both, combining their records is a viable option to better assess their seismic characteristics. This concept follows the principle of ergodicity (Walters, 2000). It can be described in two ways; either considering a long temporal history or a large (spatial) ensemble. Ergodicity holds in case the average outcome of the system behavior over time is the same as the average outcome of the ensemble. Thus, it is possible to describe a system through an ensemble of same or similar entities instead of demanding a very long time history. It is especially helpful for earthquake statistics where long time histories are necessary, but not available. This concept has already been applied e.g., by Nanjo et al. (2011), Bungum et al. (2005) or Kagan and Jackson (1994). Here, it is used to assess the similarity and seismic-tectonic earthquake potentials of different subduction zones. No subduction zone is like another. However, they still share distinct similarities like plate age, geometry, volcanism, etc. But some subduction zones are more similar than others. Thus, it is necessary to quantify their similarity, assuming that it is a proxy for the seismo-genic potential, on the basis of an extensive parametric assessment.
This study can be split into 3 main components. As a basis, the first part introduces an extensive subduction zone-related parameter database including a basic correlation analysis between these parameters and historically observed Mmax values. Afterwards, the potential maximum magnitudes are assessed using a variety of statistical and machine learning procedures. Here, the principle of “trading time with space" is followed. The results are combined using a logic tree approach to provide a range of potential Mmax estimates. Afterwards, earthquake return periods are calculated using plate tectonic modeling and historic earthquake statistics on the basis of a tapered Gutenberg-Richter distribution. These results have been compiled by computing the related parameter uncertainties using a bootstrapping methodology. It allowed to quantify not only a mean estimate of earthquake return periods, but also their uncertainties. The results have been reviewed in regards of plausibility (e.g., in regards of the historic record or paleo-seismologic findings) and consistency with previous studies.
2. Data
2.1. Overview
To analyse subduction zones as source regions of large earthquakes, an extensive data collection was undertaken. The results have been combined in a global parameter database on subduction zones which covers information on for example geometry, seismicity, morphology. Geometric parameters have been derived from plate tectonic modeling which also provides estimates for plate convergence rates. Digital elevation data, crustal strain rate data and geodetic observations have been compiled at, along and around subduction zone interfaces. As it will be described below, 76 subduction zone segments have been defined. Used data sources are listed in Table 1. First, a description of the used earthquakes catalogs is provided which have been employed e.g., to estimate the down-going slab geometry and earthquake magnitude return periods. Afterwards, the database and its parameters is described in detail. The complete parameter database can be found in the Supplementary Material of this manuscript.
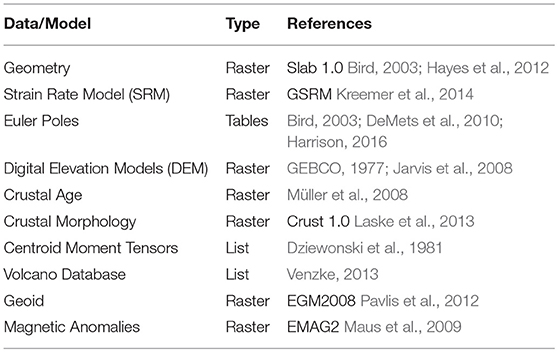
Table 1. A summarizing overview of all data sources considered for the assessment of subduction zone parameters.
2.2. Earthquake Catalogs
An extensive collection of earthquake catalogs on a global scale was undertaken. As a basis, the ISC-GEM catalog (Storchak et al., 2013) for the instrumental period (1900–2016) and the GEM-GHEC (Albini et al., 2014) for the historic period (pre–1900) were used. Both catalogs have been extended by various local and regional earthquake catalogs (e.g., Dziewonski et al., 1981; Shebalin and Leydecker, 1997; Halchuk et al., 2015; GNS, 2016; Rovida et al., 2016) for which magnitudes have been converted to moment magnitudes. The minimum magnitude of Mw ≥ 3.5 has been adjusted depending on spatio-temporal completeness using the Temporal Course of Earthquake Frequency (TCEF) method [see Gasperini and Ferrari (2000) and Nasir et al. (2013)]. The TCEF method describes the temporal earthquake record and identifies the year of completeness by considering the temporal evolution of earthquake records. The combination of all catalogs took place avoiding duplicates based on an automatic algorithm considering detection uncertainties and a weighting procedure with respect to catalog quality and completeness. In addition, earthquakes of Mw ≥ 7.0 have been all reassessed manually and compared to recent studies to assemble an as-complete-as-possible collection of the latest knowledge on historic megathrust earthquakes including the literature-related uncertainties.
Event attribution to each subduction zone was simplified by considering all events which occurred within the envelope the down-going slab and with a depth difference between the earthquake hypocenter and the down-going slab geometry not larger than 20 km. Thus, it is ensured that only events along the subducting slab were considered and shallow crustal events in the overriding plate have been discarded. This ensemble catalog was used for the Mmax and return period assessment.
Within the following sections, it is necessary to keep 2 definitions of Mmax separate. The first one, Mh, describes the so-far recorded, either by written history or paleoseismology, largest magnitude at a subduction segment. However, when this study refers to Mmax, the absolute expected maximum magnitude for a subduction segment is meant. Any further terminology-related variations of Mmax are described when necessary.
2.3. Data Description
The development of subduction zone source geometries corresponds to a 3D representation of the plate interface following the down-going slab into the earth's mantle. Such geometries have been built in the past, mostly inferred from tomography and seismological data as done by Hayes et al. (2012, 2018). Here, a new set of subduction zone geometries has been assembled in two steps: First, the location of subduction onset was determined using the plate boundary model of Bird (2003). Secondly, the subduction geometry consists of almost a total of 2000 down-dip profiles based on earthquake hypocenters for all zones. Subduction zones have been split into discrete along-strike segments defined e.g., by plate boundaries (either in the overriding or the subducting plate) or based on major changes in along-strike directions, e.g., between Sumatra and Java or Mariana and Izu-Bonin plate segments (Lallemand, 2016).
As shown in Table 2, a total of 50 parameters have been compiled. The selection of these parameters was based on both global availability or discretization and the assumption that any of them is directly or indirectly related to the subduction process.
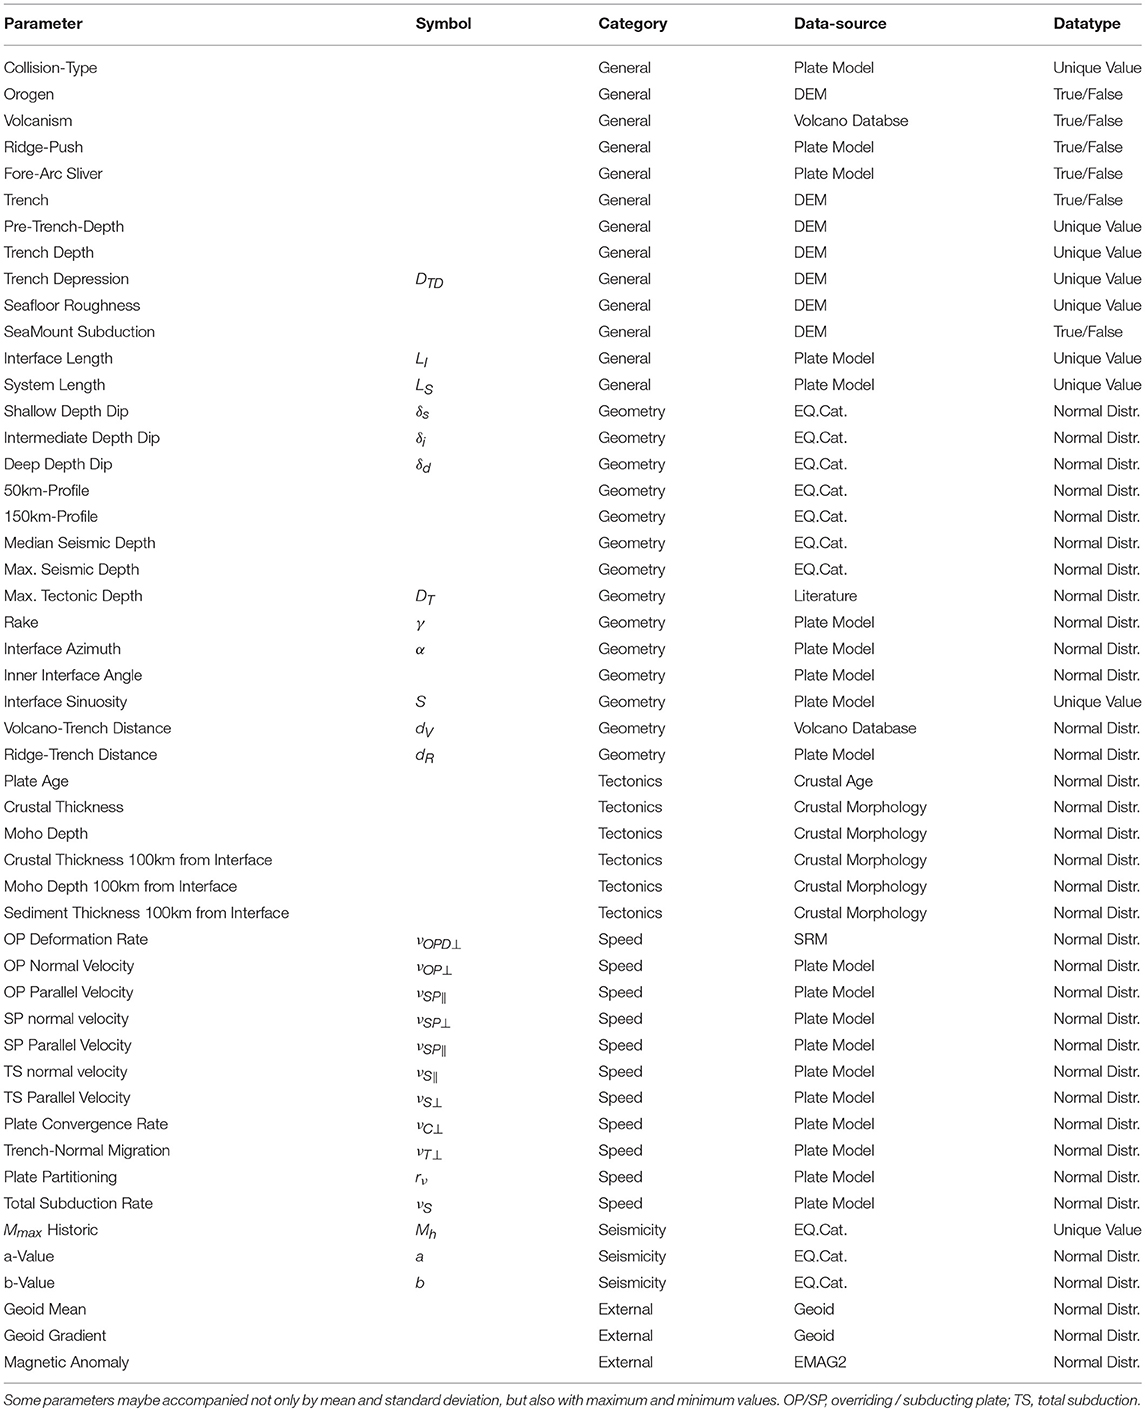
Table 2. Overview of all parameters assessed within the subduction zone parameter database.
In some cases, parameters are just binary. For example, a subduction zone can be associated with an active orogenic process or not. Other parameters can be uniquely defined like the length of the subduction interface. However, the majority of parameters is not unique. They either vary depending on the used data source or generally along the subduction interface. Those have been defined providing mean, maximum, minimum and the variance. This variability has been summarized in a collection of box plots for most parameters in Figure 1.
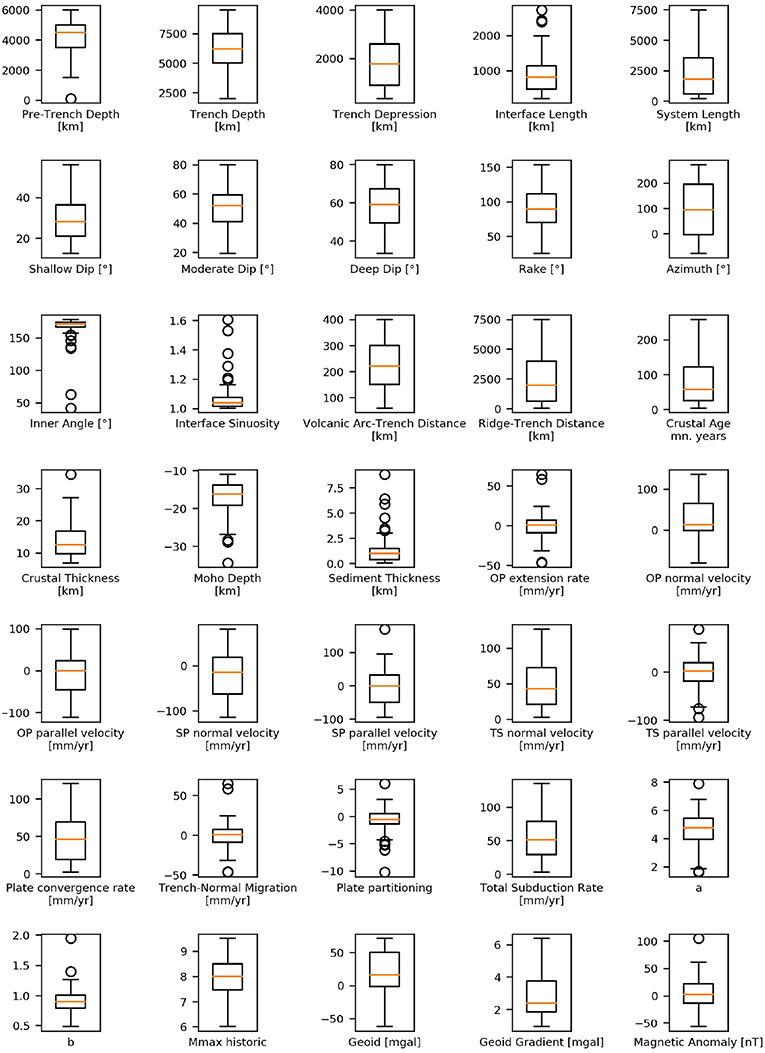
Figure 1. Summary of most subduction zone parameters showing their respective box plot statistics.
All parameters can be grouped into 6 classes: Subduction Geometry comprises a set of parameters derived from the plate interface geometry including the interface azimuth, rake was derived from the subduction direction which is relevant for regions with oblique subduction and interface sinuosity as a description for the subduction interface curvature. Tectonic and Geologic Parameters contain all characteristics associated with geological and tectonic processes. They have been sampled at the interface and 100 km beyond it on the overriding plate. This category includes parameters like plate age, crustal thickness and others. The Subduction Movement category uses mostly data derived from the plate boundary model associated with the various Euler poles and were computed using the equations of Schellart and Rawlinson (2013). It comprises velocity information about the down-going and overriding plates and various derivatives including the very important subduction velocity describing the absolute plate convergence rate. Most of them were compiled in trench-normal and trench-perpendicular direction. Seismicity parameters were derived from the observed seismic history including maximum historic magnitudes and computed Gutenberg-Richter values using the global catalog introduced above. External Parameters were drawn from additional datasets including the amplitude of the geoid and the magnetic anomaly, assessing also the geoid gradient as the difference between the absolute maximum and minimum within 300 km of the plate interface. Finally, General Parameters describe a selection which can not be associated with any other broader category, it contains all binary and discrete data on a subduction zone, like the presence of a trench, the interface length or volcanism and all elevation related information.
The compilation of tectonic plates uses various estimates for plate movement based on Euler poles. Here, global studies like (Bird, 2003; DeMets et al., 2010; Argus et al., 2011; Kreemer et al., 2014) were compiled and combined. In addition, these results have been compared to the discrete plate motion block models on a regional basis e.g., from Symithe et al. (2015) and Benford et al. (2012) for the Caribbean or Rangin et al. (1999) for South-East Asia around the Philippines. All plates obtained from the global studies are defined in the Pacific standard reference frame. Whenever the studies provide different estimates for a plate's Euler pole, each possible combination is considered to provide a range of convergence rates and movement direction. For example, the dataset provides 3 different poles for the South American plate as well as for the Nazca plate, which results into 9 different combinations of plate motion.
Most parameters can be derived very straight forwardly. Regarding the interface geometry, the average Azimuth of the plate interface has been estimated while the amplitude of interface curvature was estimated by the interface sinuosity S, which can be calculated by:
where Li is the length of each interface segment, N is the total number of segments and L0 being the direct distance between the two ends of the interface. The sinuosity S is always > 1 and applying the definitions on river curvatures of Mueller (1968), the interface can be considered almost straight for S < 1.05 and winding for 1.05 ≤ S < 1.25, twisty for 1.25 ≤ S < 1.5 and for S ≥ 1.5 the interface can be considered as meandering. In addition, the average inner interface angle between 2 subduction zone polyline segments was also resolved. Seafloor roughness was considered qualitatively be checking the existance of seamounts along the subduction path. Recently Lallemand et al. (2018) introduced a quantitative methodology based on spectral assessment of sea floor features which can be applied for future iterations of this study. Schellart and Rawlinson (2013) already modeled various plate movement parameters in detail. Thus, the following plate velocity compilation was built on their description. As a basis, a collection of Euler poles was used as described above, covering also variabilities between different plate tectonic models. The definitions of plate-normal and plate-parallel were based on the subduction interface geometry. Considering plate-movement positive in direction of the overriding plate as plate-normal and movement along the interface as plate-parallel. In total, 7 parameters can be derived, 3 of them are defined in trench-normal and -parallel directions with their respective potential mean and standard deviation taking into account along-interface and intra-model variations:
• νOPD⊥ is the overriding plate deformation rate, and directly derived from global strain rate data of Kreemer et al. (2014). Here, the first 300 km plate-inwards from the interface are taken into account.
• νSP⊥ & νSP∥ define the subduction plate trench-normal velocity and subduction plate trench-parallel velocity.
• νOP⊥ & νOP∥ define the overriding Plate trench-normal velocity and overriding plate trench-parallel velocity.
• νT⊥ is the trench-normal migration velocity. It describes the subduction hinge migration or rollback velocity.
• νS⊥ & νS∥ is the total subduction trench-normal velocity and total subduction trench-parallel velocity.
• νC⊥ is the trench-normal plate convergence rate.
• rν⊥ is the trench-normal subduction partitioning ratio defining the proportion of movement accomodated by trenchward motion of the subducting plate.
While νOP, νSP and νOPD derived directly from plate movement and geodetic data, all other parameters are derivatives of those with the following set of equations:
In contrast to Schellart and Rawlinson (2013), νA was not considered, which is defined as being the overriding plate accretion and erosion rate for which only for a small number of subduction zones data is available. In addition, νA is significantly smaller (< 20%) than both νSP and νOP for most subduction zones (Clift and Vannucchi, 2004). For the calculation of seismic moment accumulation νC is used since νOPD can be prone to short-term variations and some tectonic implications are still unclear.
3. Methods
3.1. Machine Learning
The area of machine learning provides a wide range of methods for statistical data prediction (Pedregosa et al., 2011a). It follows the assumption that, based on a set of observations X1 with known outcome Y1, the unknown results Y2 can be predicted by observations X2, if both observations are part of the same process and X1 and X2 contain the same types of parameters. In this study, various machine learning methods have been applied. They were provided within the software package scikit-learn Pedregosa et al. (2011b). Within the terminology of machine learning, predicting Mmax can be described as a supervised learning approach. A few other studies also recently applied machine learning in earthquake science, for example for earthquake prediction (Bergen et al., 2019; Corbi et al., 2019).
3.1.1. Classification
First, to identify classes of subduction zones of common characteristics Lloyd's algorithm for k-means clustering was used (Lloyd, 1982). It is a general-purpose clustering method which can be applied with an arbitrary number of dimensions for a specific number of demanded clusters. Given a set of n observations with parameters x and a target of k clusters, the algorithm aims to minimize the within-cluster distances of squares for each cluster ki with its centroid μi among all provided parameters, which have been normalized between 0 and 1 to keep them equally weighted. Same holds for binary parameters which were already defined this way. But, the assumption of equal weights may not necessarily be correct, some parameters may be more important than others. Thus, parameter weights have been sampled randomly using a Monte Carlo approach. Some are, as described above, correlated implicitly increasing the weighting of their underlying characteristics. Thus, the random weights were additionally adjusted by the inverse of their linear correlation coefficients.
The number of classes n is initially unknown, too. To identify subduction zone classes of common characteristics and potentially similar seismic behavior, at least 4 classes were used as a minimum level of differentiation. A maximum of 20 classes ensured that the average class size was not smaller than 4 maintaining a minimum amount of information preserved in each class. The best estimate for n is initially unknown. Thus, To provide an additional metric for identifying subduction zone similarity, the classification likelihood was also assessed. This not only covered varying parameter samples and weights, but also the varying number of classes from 4 to 20. The probability that two subduction zones occur in the same class was hereby considered a key metric, which was then called the mating rate rm. It describes the ratio between number of observations with two subduction zones in the same class. Parameter values were sampled, if applicable, from their respective standard deviation p times. Similarly, the weights are also sampled for each parameter randomly for another l times. Thus, the classification of n classes was based on l × p simulations. Within this study, to sufficiently cover all variations, l = 1, 000 and p = 1, 000 was applied.
The classification aimed to retrieve two main metrics. First, the general similarity is assessed. The mating rate rm is used to identify the most similar subduction zones assuming that also Mmax should be very similar. In addition, the classes were rated based on their average Mh. Classes were sorted from the smallest mean Mh to the highest considering all sampling uncertainties. This procedure helped to identify classes of dominently strong megathrust activity and those with only limited historic records.
3.1.2. Supervised Learning
On the other hand, machine learning methods have been applied to identify multi-variate correlations among subduction parameters to estimate Mmax. This is especially helpful when assuming that some of those correlations are either in scale or complexity beyond any low-dimensional regression (involving more than 1–2 different parameters) and thus almost impossible to be assessed by bare eye. For this task, a set of common machine learning methods have been applied. Not only, the above described k-nearest neighbor method (KNN) was applied. But also decision trees, random forests, gradient boosting methods and support vector machines were used: Decision trees are straight forward attribute-based probability systems of conditional statements. However, especially in complex or not well quantified systems, decision trees are not unique. Thus, random forests (RF) represent an ensemble of decision trees which randomize parameter sampling when building individual trees. The result of a RF represents the mean among all decision trees in the forest. In contrast, gradient boosting (GB) algorithms compute decision trees on the basis of a statistical loss function. Thus, instead of computing an ensemble system, a single tree is sequentially improved over many iterations to get a best-estimate. Finally, support-vector-machines (SVM) were used. They discretize the whole parameter space in regions which represent a common result split by trained multi-dimensional hyperplanes.
Those methods have been applied to estimate Mmax. Here, a bootstrapping methodology was used splitting the subduction zone data into a group of test and training data. For the training data (always randomly sampled from 25–75% of all zones), it was assumed that Mh = Mmax being the target values and that Mh is unknown for the remaining zones. This procedure was repeated 10,000 times to cover uncertainties in the selection of test and training data.
3.2. Mmax Logic Tree
An ensemble approach was utilized for the final assessment of potential Mmax at subduction zones. It comprises the above introduced classification and correlation methods and summarizes the respective results within weighted ensemble-Mmax estimates, which are all at least equal or larger than Mh. Method-specific estimates for Mmax are later-on called . In total, 4 different equally-weighted methods or method groups were part of the ensemble using:
• Magnitude-dependent relation equations with respect to available rupture area resolved from literature.
• Magnitude-dependent linear and quadratic correlation equations.
• Machine learning Mmax estimation using the subduction zone parameter database.
• Subduction zone classification and parameter range results as introduced in the sections above.
The respective results have been compared and combined to provide a preferred Mmax estimate for all subduction zones. The structure is outlined in Figure 2 showing 3 paths to obtain the resulting metrics which are a preferred, average expected magnitude Mpref and lower and upper estimates M1 and M2.
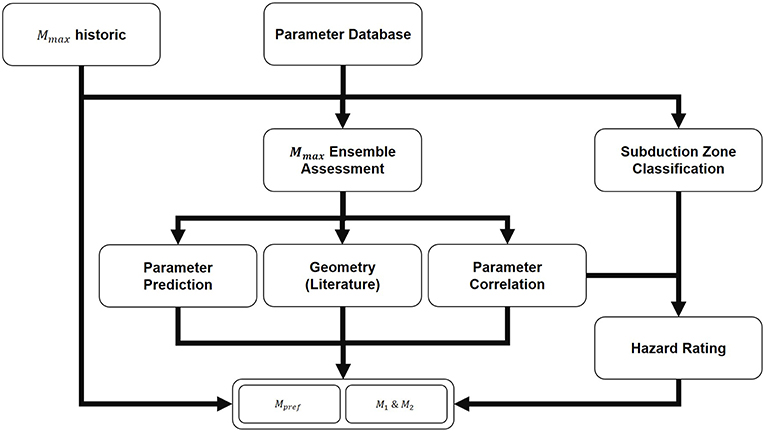
Figure 2. Flow chart of the ensemble approach to determine Mmax.
First, the historic Mmax provides a minimum threshold for future events. Secondly, the results of the different Mmax analysis methods provide method-specific , , and , which add into the final logic tree. The calculation of correlation results is straight forward where not only the mean estimates were considered, which provide an estimate for , but also method-specific and when taking ±σ into account.
This also includes the uncertainties of geometry-related literature equation for which the respective subduction zone interface length was used. For the computation of using machine learning, decision trees, nearest neighbor and gradient boosting methods were used. Lastly, the subduction zone classification rating and the parameter range results only provide normalized hazard ratings hr between 0 and 1. In this case, was computed considering these values as the linear distance between and resolved from the correlation and machine learning results using the following equation.
Another options to compute Mmax could be to derive it directly from the respective seismicity as described by Kijko (2004). However, Zöller and Holschneider (2015) show that the historic seismicity can not necessarily describe Mmax and since this study focusses non-seismicity related methodologies to derive it, a purely seismicity-based approach was not considered.
Geometry-related Mmax have been computed using various studies which already examined the relation between earthquake size in terms of its rupture length or area and its magnitude. Thus, assuming a full-rupture scenario, the equations of Goda et al. (2016), Wells and Coppersmith (1994), Papazachos et al. (2004), Murotani et al. (2013), Skarlatoudis et al. (2016) and Thingbaijam et al. (2017) were used to provide another estimate for Mmax based on the subduction zone interface length.
When building the ensemble of all methods, 4 equally weighted subgroups can be identified. Secondly, 4 machine learning methods provide combined, equally weighted estimates , , and . The same metrics had been derived from 6 geometry-related relationships taken from the publications listed above. Similarly, the correlation equations introduced before provide another set of , , and just like the results of the similarity assessment which build on the uncertainties of the other methodologies. The final results were computed using the average of providing the preferred magnitude Mpref, and the second highest M1 and lowest values M2 for Mmax over all provided results of all three groups. In Table 3, the 4 subgroups have been summarized with respect to their median estimates by the columns for Cl, Classification; Co, Correlation; Ml, Machine Learning; Ge, Geometry.
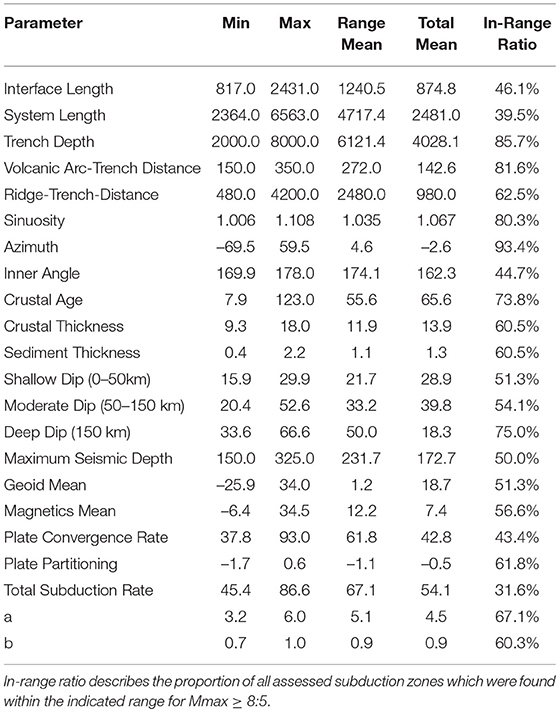
Table 3. Overview of the assessed subduction zone parameter ranges for the historic Mmax.
3.3. Tapered Gutenberg-Richter
Quantification of earthquake return periods was based on the tapered Gutenberg-Richter method as used by e.g., Kagan (2002) or Rong et al. (2014) making use of seismic moment rates and data completeness introducing corner magnitude Mc and magnitude threshold M. In addition, it is defined using , where b is the standard Gutenberg-Richter b-value (Gutenberg and Richter, 1956). The method computes an seismic moment release rate instead of a distinct earthquake magnitude rate. The whole expression is defined by:
With earthquake occurrence rate λ, seismic moment rate Ṁs and the threshold magnitude's average annual rate of occurrence αt. The resulting earthquake moment release rates were converted into their respective moment magnitude return periods. Scholz and Campos (2012) already provide estimates on the seismic coupling factor χ. Despite the high quality of this research, the underlying paleoseismic data may be incomplete and seismic coupling may change over time. Thus, since χ is prone to major uncertainties, to avoid underestimation of the resulting return periods and since some subduction zones were not included in their original assessment, here, a flat value of χ = 1 was assumed. In future studies variations of χ should be taken into account to better investigate potential uncertainties and their implications e.g., in regards of a major reduction of large magnitude occurrence rates. The maximum possible magnitude for each subduction zone, independent of the tapering effect, was based on the assessment above. To take into account the epistemic variability, uncertainties of a and b values due to bootstrapping have been considered. Similarly, seismic moment accumulation rates and their uncertainties as they have been derived from variations in Euler pole selections (e.g., Bird, 2003; Kreemer et al., 2014; Harrison, 2016).
a and b values were computed using linear regression under consideration of the catalog completeness within the respective subduction zone region. Magnitudes and completeness have been binned with a stepping of △M = 0.1. Bootstrapping was applied in two ways. First, in regards of only considering 75% of the available earthquake data (while a is always normalized using the base-rate of all earthquakes). Secondly, regarding the magnitude binning of only using 75% of the bins in case at least 4 were available. This procedure ensured uncertainty quantification but also maintained a minimum amount of information to compute a and b values. The resulting set of values, including their potential uncertainty, was further used to compute tapered Gutenberg-Richter distributions with respect to the inherent uncertainties.
4. Results
The results section first focuses on linear and constant correlations of subduction zone parameters with Mh and covering the classification of subduction zones to identify subduction zone groups of common characteristics and respective implications. Afterwards, results of the ensemble approach to estimate Mmax are shown. Finally, the tapered Gutenberg-Richter results are presented to provide estimates on the return periods of large earthquakes of Mw ≥ 8.0 for the assessed subduction zones.
4.1. Statistical Assessment
4.1.1. Mmax Correlation
A correlation assessment was taken out to identify cross-parametric relationships with Mh which is the largest historically observed magnitude. Thus, Mmax may be still underestimated in many places where the strongest possible event has not yet been observed. But, assuming that for a majority of subduction zones with Mmaxobs ≥ 8.5, earthquakes close to Mmax already occurred, parameter correlations can indicate which boundary conditions are necessary to enable such large megathrust earthquakes.
As a first step, discrete ranges for each parameter in which earthquakes of Mw ≥ 8.5 have occurred were investigated similar to the study of Schellart and Rawlinson (2013). Here, the minimum and maximum value of each parameter space was determined in which such earthquakes have occurred historically. The statistical relevance was described by the in-range ratio which summarizes the number of all subduction zones which were found in the indicated range. A large in-range ratio means that its criteria is satisfied for almost all zones and thus irrelevant. However, a small ratio covers a clearly defined parameter space which allowed the occurrence of large earthquakes historically. For several parameters, discrete ranges indicate characteristics beneficial to cause large megathrust earthquakes. For example, less than 50% of all subduction zones can be found within the range where Mw ≥ 8.5 occurred historically in regards of their system or interface length. Similarly, it can be seen that straight subduction zones were also more prone to produce those events. Very big earthquakes only occurred at subduction zones with small to moderate shallow dipping angles between 16° and 30°, as shown by e.g., Bletery et al. (2016). Various more ranges have been identified and are shown in Table 4.
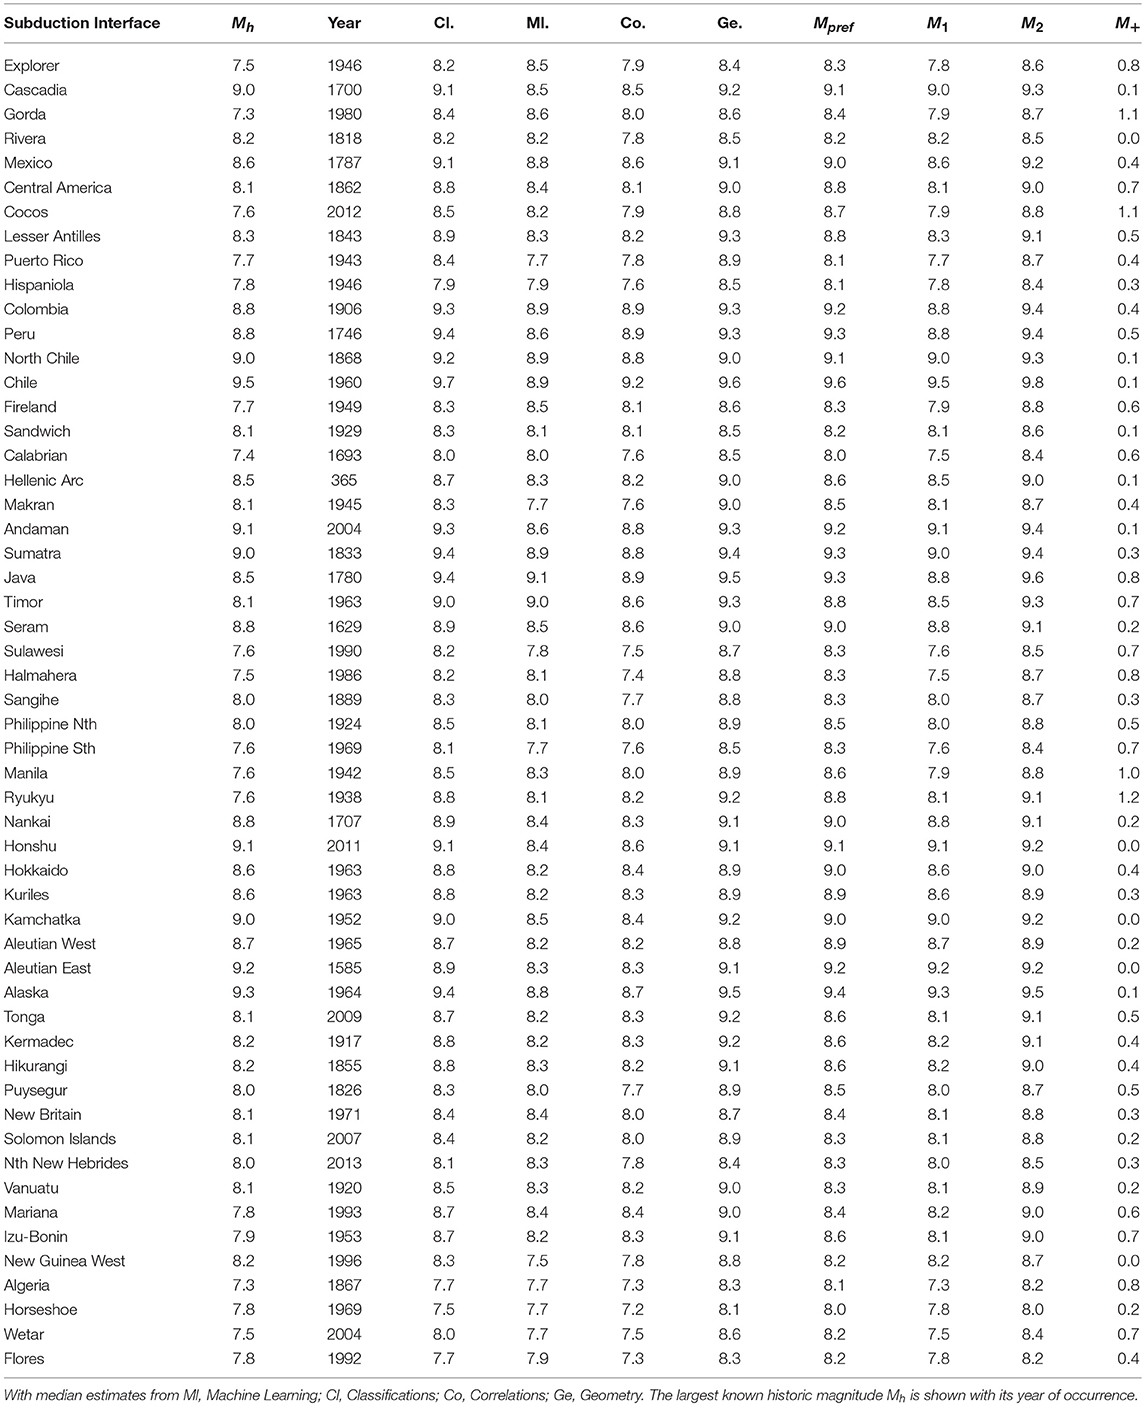
Table 4. Collection of resulting Mmax estimates of all logic tree components for subduction zones with Mpref ≥ 8.0.
In addition, linear relationships between the various parameters and Mh have been assessed. However, following the premise of machine learning, higher order correlations have been neglected assuming that more complex relationships between Mh and subduction characteristics are beyond polynomial statistics. To quantify correlation quality, the Pearson coefficient R0 was used.
Regarding 1D correlations (Mh compared to 1 other parameter), a total of 4 equations were found, and 13 for the 2D case (Mh compared to two different parameters) with sufficient quality (R0 ≥ 0.6). Of all assessed parameters, only 4 showed sufficient correlation with Mh. All of them were directly derived from the subduction interface's geometry. The first two equations the interface length LI and the system length LS, both in km, where the latter describes the combined extent of e.g., the complete South American subduction system. It was found, that Mh correlates much better with LS (R0 = 0.71) than with the LI (R0 = 0.594). It indicates that segmentation of a subduction interface may not necessarily reduce Mh. The other two equations are related to the down-going slab. First, the distance between the volcanic back-arc and the trench dV in km, which depends on the dip between subduction onset and the point where the mantle-slab interaction can cause volcanic activity at the surface of the overriding plate. Thus, slab dip, in degree, of intermediate depths (50-150km) δi is correlating similarly. Both support the observation of e.g., Bletery et al. (2016) that smaller dipping angles are beneficial for the generation of large earthquakes.
For 2D correlations, additional parameters include plate age, geoid mean along the subduction interface, trench depth, trench depression depth, deep slab dip (≥150 km) and the trench-normal subduction velocity. 8 of these equations include either LI or LS. This corresponds to the findings above that those parameters already correlate well with Mh in the 1D case. For most of these new equations, the correlation factor was increased by up to 17%-points. LS combined with the intermediate dip δi lead to one of the best correlated equations. The 2D parameter correlation for plate age and subduction velocity of Ruff and Kanamori (1980) did not provide sufficient quality (|R0| = 0.32). However, plate age correlated better combined with δi. The best correlations were found for a combination of δi and dV which was also already introduced for 1D correlation and again, the combination yielded a higher correlation quality of about 6%-points. The resulting equations have been summarized in Table 5 on the basis of the following equation structure.
Beyond linear combinations of these correlations, more complex systems can be identified. However, finding those demands a more complex rational and causal review, but are good examples for hidden relationships. One example considered the logarithmic quotient between δi and dV which is increasing the correlation to |R0| = 0.72.
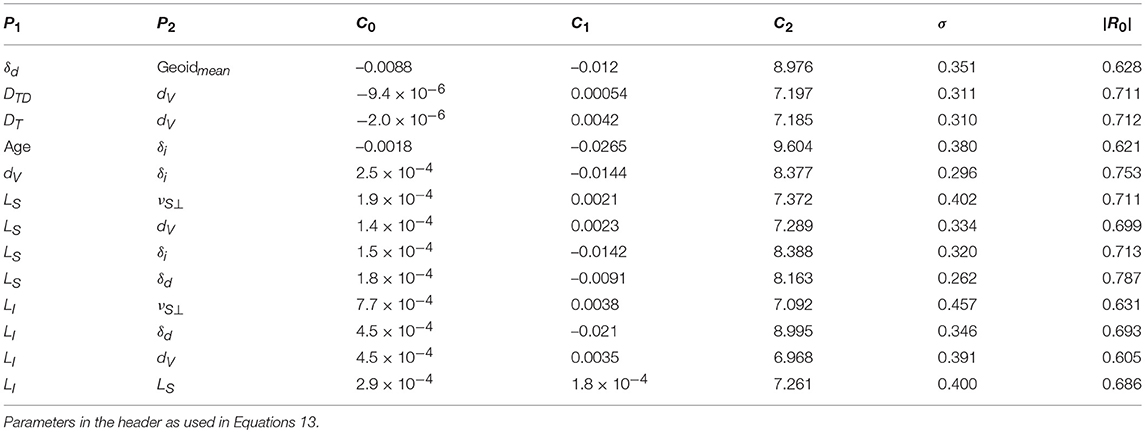
Table 5. Overview 2D regression results and parameters to compute Mmax.
In conclusion, the parameter database revealed several well-correlated relationships between subduction zone parameters and Mh. Even though, those relations may be underestimating since it can be expected that the historic Mmax is smaller than the actual potential maximum magnitude. Nonetheless, these correlations help to identify subduction zones where their geometric or tectonic characteristics indicate a potential Mmax much larger than what has been observed historically.
4.2. Subduction Zone Classification
With the subduction zone parameter database it is possible to quantify and validate both the potential maximum magnitude and, as later shown, return periods of large megathrust earthquakes. The statistical return period assessment provides an a priori approach to identify the hazard, but since it is a statistical methodology, physical constraints are not necessarily well represented. This holds true in regards of Mmax which needs to be defined independently. The validation and optional adjustment of the computed hazard is undertaken by classification using k-means clustering within a Monte Carlo approach. The procedure follows the principle of trading time with space. The system links to the above introduced correlation assessment and provides an alternative way to quantify the capability of subduction zones to produce very strong earthquakes on a comparative basis.
A total of 49 parameters were used (excluding Mh). Of those, 35 were sampled from their respective normal distribution. As, k-means clustering demands a discrete number of classes as input, the classification procedure has been applied 17 times for n = [4, 20] classes. 2 metrics have been derived, hazard level classification hr based on Mh and the similarity-based mating rate rm. The hazard level describes a Mh-based ranking of the individual subduction zone classes and the rm quantifies how similar two subduction zones are.
Uncertainty plays an important role in the classification of subduction zones. To combine all permutations of the classification process regarding parameters, weighting, combinations and number of classes, the results have been normalized based on Mh of each group. The normalization works independent of any permutation.
All classification results were combined into probability curves showing the potential of being classified among the highest or lowest rated subduction zone classes with respect to Mh. These results are shown in Figure 3. In addition, the hazard level probability can be summarized by its average hazard level between 0 and 1. Here 1 denotes a classification among subduction zones with the largest Mh like Chile, while 0 is generally associated with subduction zones of no or limited seismic activity like the Yap Trench. It can be seen that this procedure clearly outlines the classification uncertainty but also provides an average estimate about how subduction zones share characteristics to produce very large earthquakes. This rating does not yet provide a direct estimate for Mmax, but it can outline the qualitative potential to produce large earthquakes compared to other subduction zones.
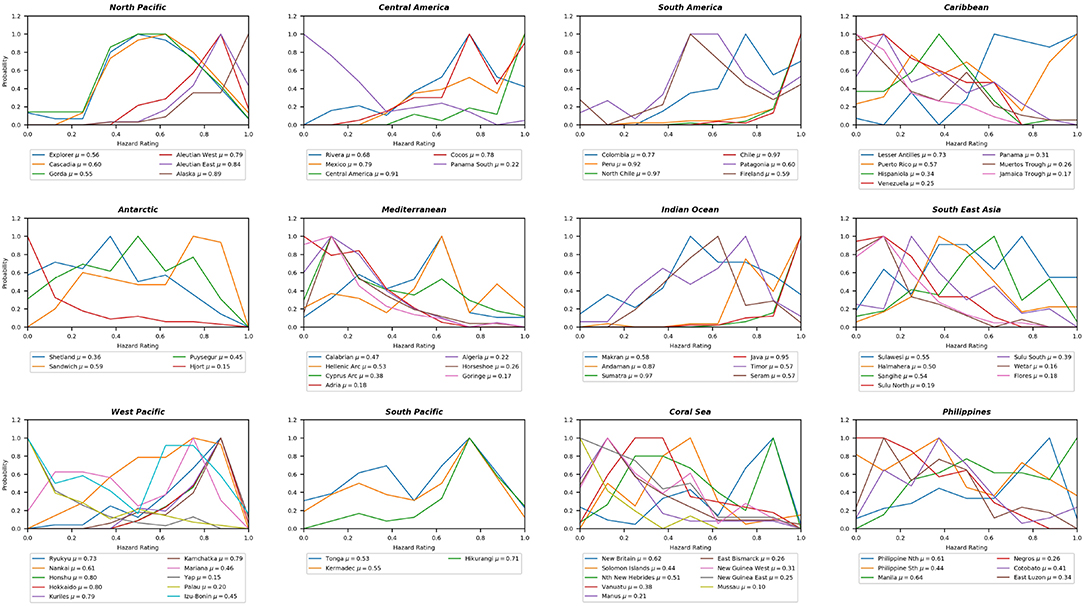
Figure 3. Overview of all subduction zones split into different geographic regions. The graph shows the hazard rating probability. An increase of the hazard rating implies a stronger correlation with subduction zones of very large Mh.
The results of the subduction mating can be seen in Figure 4. Here, the color indicates how similar two subduction zones are, where red shows a strong similarity and blue identifies a very weak one or none at all. Several yellow-red blocks along the main diagonal show groups of subduction zones which are generally very close in space for example in the center where the subduction system from Ryukyu to Honshu and the Aleutians shows a strong similarity.
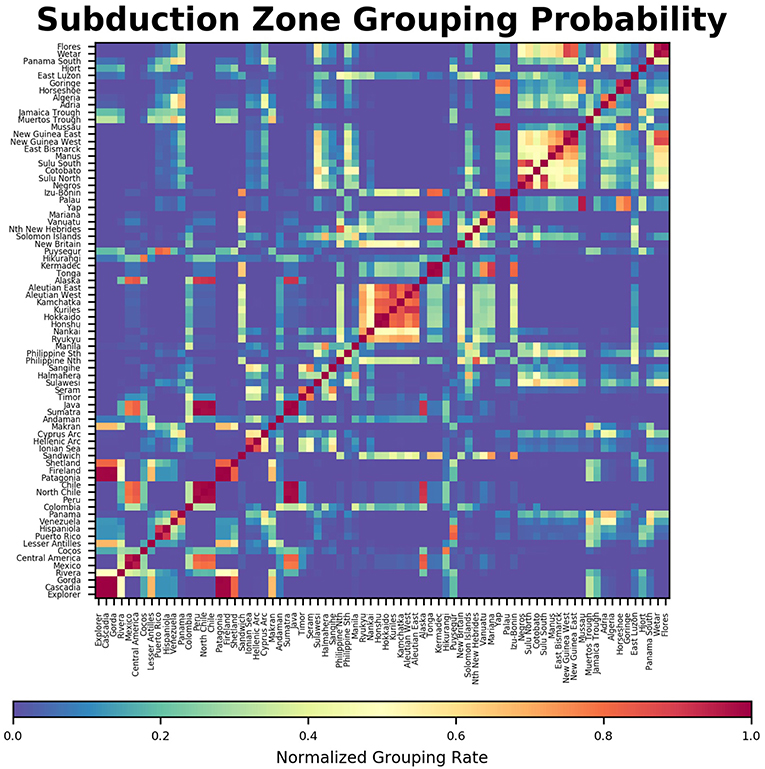
Figure 4. Probability of subduction zone mating, where 1 (red): subduction zones always group within the same class and 0 (blue): subduction zones never same the share class.
4.3. Maximum Magnitude Assessment
The expected combined Mmax metrics resulting from the 4 different methods have been summarized, together with the average Mmax of the individual methods, in Table 5 and Figure 5. Here, M+ describes the increase of Mpref with respect to the historic Mh. Currently, the absolute global maximum is capped at 9.6 with respect to the 1960 Chile earthquakes. In case a larger earthquake may occur some time in the future, this limit may need to be reassessed.
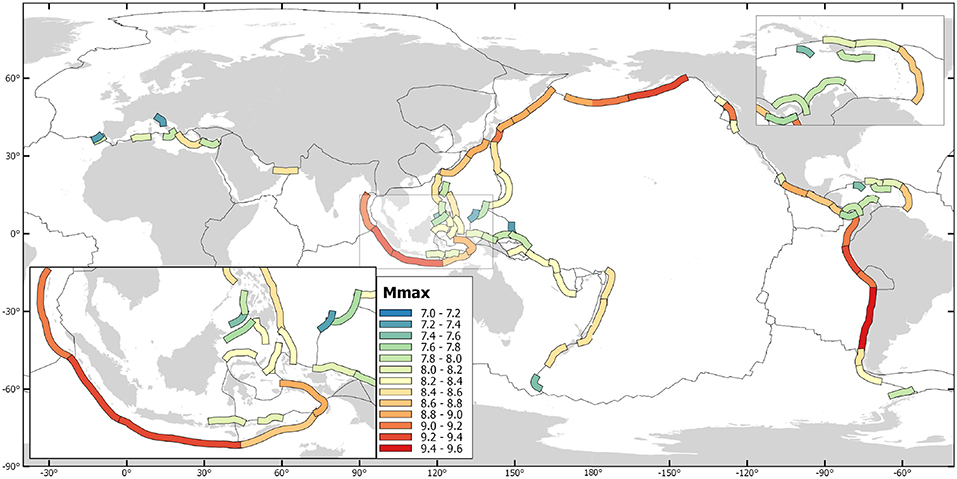
Figure 5. Map of the preferred maximum magnitude estimates for all assessment subduction zones.
The results indicate various subduction zones with a significantly elevated Mpref with respect to its Mh. Of special interest were regions where the magnitude difference was larger than 0.5 or where Mpref ≥ 9.0. Most subduction zones reach Mpref ≥ 8.5 and at least M2 ≥ 8.0 holds true for almost all cases. Thus, some regions where the historic maximum is below 8.0 observe a significant increase larger than 0.5 or even more than 1 point of magnitude. But, there are also several subduction zones with Mpref ≥ 9.0 or M2 ≥ 9.0 where Mh was in some cases even below 8.5. Those regions include Central America, the Lesser Antilles, Java, the Tonga-Kermadec-Hikurangi system and the Nankai Through.
For another subset of subduction zones, the increase is negligible and in the range of +0.1 − 0.2. This is mostly true for regions where Mw ≥ 9.0 earthquakes have been observed as in Chile, Cascadia or around Japan. In most of these cases M2 = Mpref can be found. Thus, much larger events are not expected and that the calculation Mmax is driven by the historic Mmax as a minimum threshold assuming that the history is already close to the anticipated Mmax.
4.4. Return Period Assessment
The final component of this study was the assessment of large megathrust earthquake return periods using a tapered Gutenberg-Richter method. Here, the preferred estimates for maximum magnitudes Mpref of the section above were applied in conjunction with plate tectonic modeling as it was part of the subduction zone parameter database to quantify seismic moment accumulation rates for each subduction segment. The whole system was built on a bootstrapping procedure to quantify related uncertainties. As a last step, the resulting recurrence rates have been reviewed in terms of their plausibility with respect to other studies and previous results.
With Monte Carlo simulations, 10,000 permutations of 50 year long earthquake histories have been computed. The values in Table 6 describe the largest expected earthquake Mexp regarding various occurrence probabilities within those 50 years. Thus, earthquakes of M ≥ Mexp should be expected with respect to the different recurrence probabilities. On this basis, the 50, 10, 2, and 1% occurrence probabilities have been described, which represent about the return periods for 80, 475, 975, 2475, 4975, and 9975 years. These values have been computed using a stochastic simulation of various return periods. For an occurrence probability of just 1% within 50 years, Mexp ≅ Mmax holds true for most locations. Mexp was used to better show that using Mh from a short time period is many cases insufficient to extrapolate Mmax. The study shows that Mexp is increasing with longer time frames. For some subduction zones the differences are relatively small when increasing the time windows. For example in Chile, the expected maximum magnitude does not increase further for periods longer than 1,000 years which indicates that the physical maximum may be reached within this time window. However, if the seismic activity is not very high, large Mexp events demand a much longer return periods, either due to a lower a-value or a limited seismic moment accumulation rate. Regions with large b-values tend to produce their Mmax on a much longer time scale than regions with small a-values.
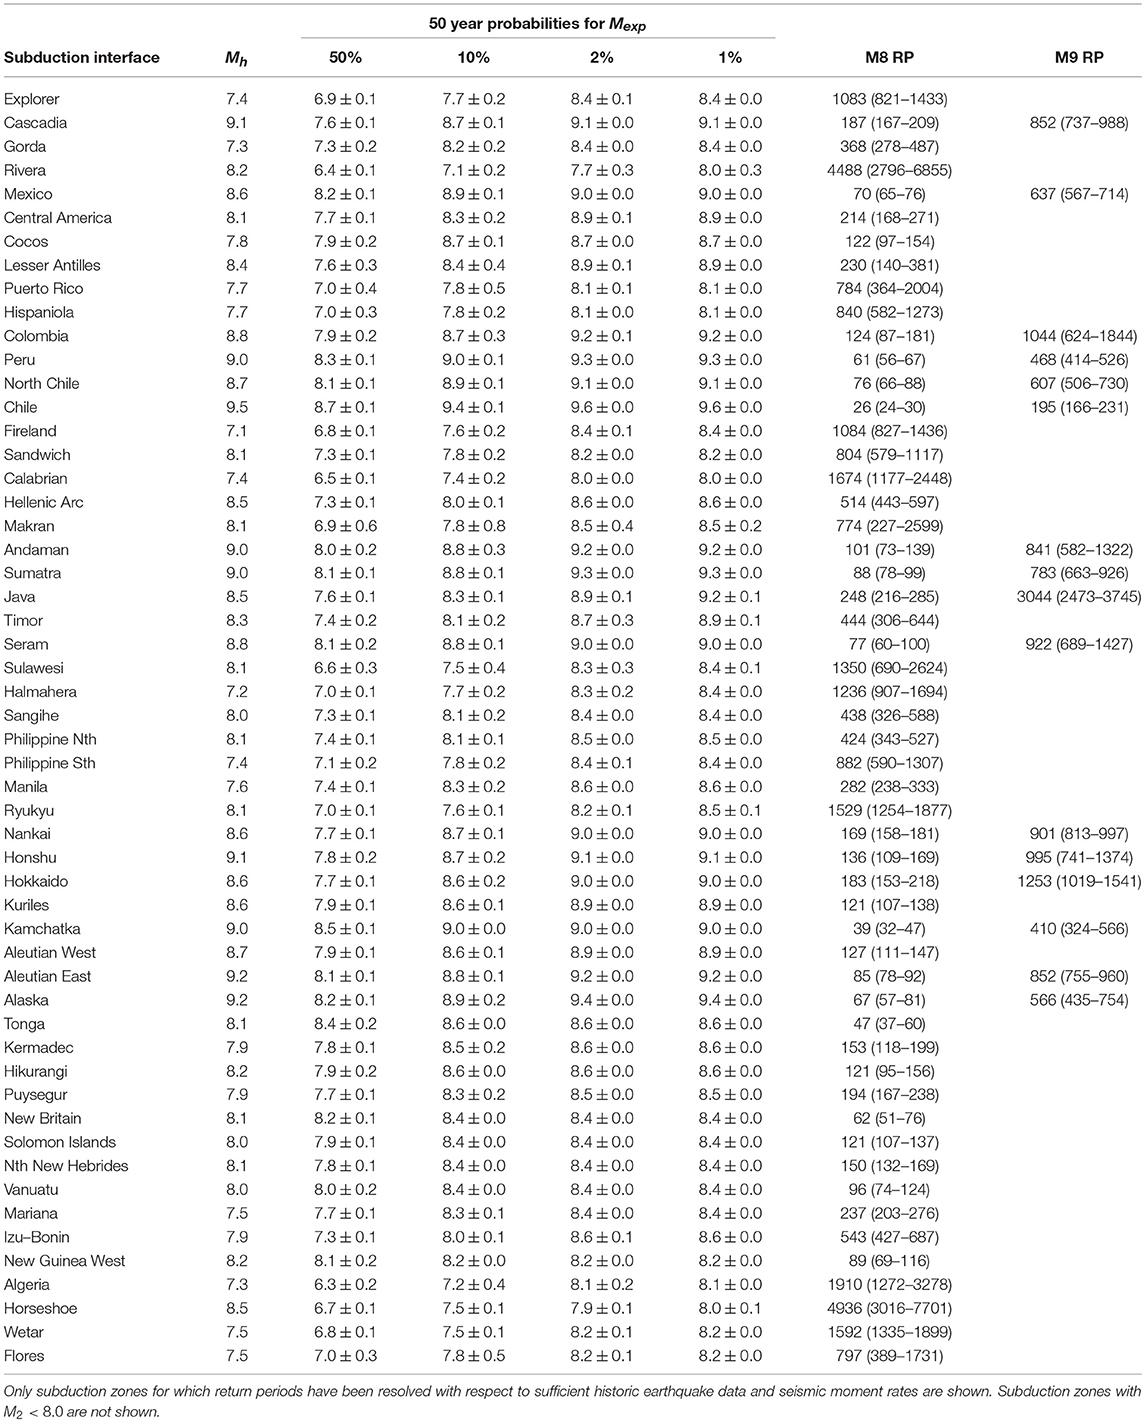
Table 6. Overview of historic maximum magnitudes Mh, Mmax, and Mexp estimates for various time frames in regards of 50-year probabilities and respective return period (RP) results and for Mw = 8 and 9.
For almost 40% of all assessed subduction zones, Mw ≥ 9.0 earthquakes are theoretically possible and three quarters of all zones get close to Mw = 9 with a potential Mmax ≥ 8.5 when considering the upper estimate for M2 from the previous section.
A few subduction zones may already reached the potential Mmax like the Central Chile trench with its 1960 Mw = 9.5 − 9.6 earthquake or the Honshu Trench with its 2011 Mw = 9.1 Tohoku earthquake. Several other subduction zones may still wait for their biggest potential earthquakes based on the proposed results. But, their respective return periods are often in the range of several thousands of years.
In summary, this methodology provides an extensive assessment specifically focused on the return periods of megathrust earthquakes and their respective potential maximum magnitudes. These results correlate well with the historic record where available, e.g., in Chile, Japan or the Mediterranean. But it also highlights the potential for megathrust earthquakes in regions where those haven't been observed yet. This includes parts of Central America, the Caribbean the Tonga-Kermadec region and many more. The results are summarized in Table 6 and parts are also shown in Figure 6.
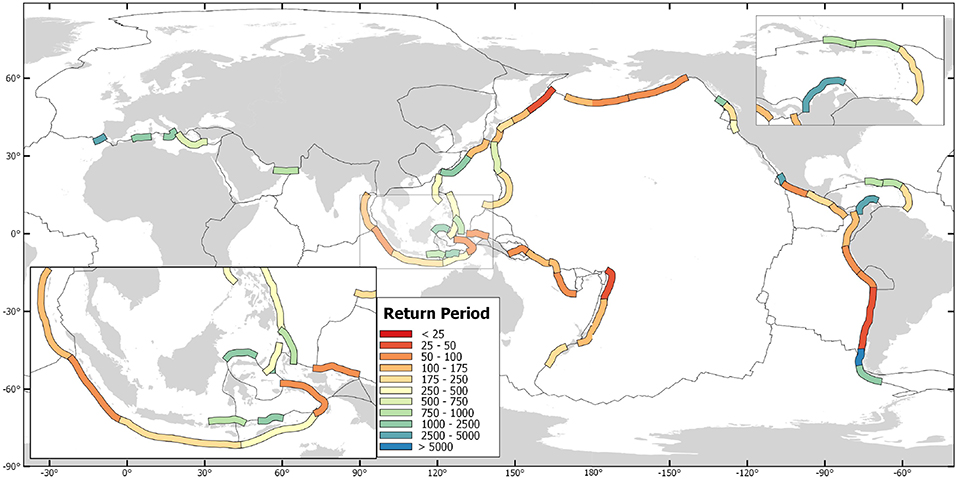
Figure 6. Map of average expected return periods in years of earthquakes of Mw ≥ 8.0.
5. Discussion
5.1. Comparison
Several other studies have already assessed potential maximum magnitudes and their return periods. Some of these studies have been listed previously. However, most important of those are the results of Rong et al. (2014), McCaffrey (2008), of Berryman et al. (2015) and Davies et al. (2017). Berryman et al. (2015) used an earthquake catalog with Mw ≥ 5.5 to confine earthquake return periods and assessed potential maximum magnitudes both on the historic record and full rupture scenarios of individual subduction segments. Their preferred Mmax, to which is referred to in this study, is the simple average between the two proposed maximum magnitudes. Davies et al. (2017) considered a logic tree approach to constrain Mmax. Their absolute maximum was set to 9.6 and otherwise constrained again by the available rupture-area. The background procedure and tectonic parameter where hereby similar to what Berryman et al. (2015) used. To compare the results, several representative subduction zones have been selected and shown in Figure 7. As expected, all models derived Mmax values larger than the historic maximum. For some subduction zones, the results of all studies were very similar, e.g., for Honshu, Chile or the Kurils. However, for most other subduction zones, the results of McCaffrey (2008) are the highest while Rong et al. (2014), Berryman et al. (2015) and Davies et al. (2017) are often around the lower end of the Mmax estimate. The results of this study are most of the time close to the results of either McCaffrey (2008) or Davies et al. (2017). However, in average the results of this study find themself as a top-end mean estimate among all these proposed studies. The results are conservative in a sense that e.g., currently not very active subduction zones, or subduction zones with no observed megathrust activity so-far, are still rated with a high Mmax, not as high as McCaffrey (2008) but also not as low as the other studies may propose.
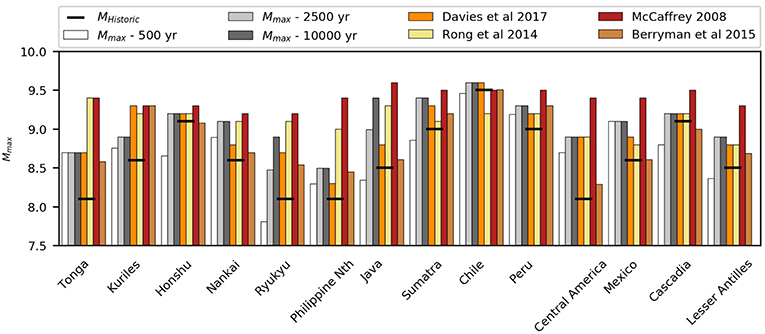
Figure 7. Comparison of some Mmax estimates based on this study for various return periods and literature results of Rong et al. (2014), McCaffrey (2008), Berryman et al. (2015) and Davies et al. (2017). In addition, black lines indicate so-far observed historic records of maximum magnitudes.
5.2. Limitations
Despite leading to results in accordance to previous studies, some limitations have to be lined out. Applying machine learning methods can be a valid alternative when assessing complex systems, if sufficient data on those is available. However, for the assessment of Mmax, supervised learning always demands for assured knowledge for a subset of subduction zones assuming Mh = Mmax. This assumption will lead to an overfitting and underestimation of Mmax in some places. The procedure doesn't help when assessing the maximum magnitude of anyway very active subduction zones like Chile which would be underestimated, but appears useful for regions where the historic record is limited. This pattern can be well seen in Table 5, where machine learning estimates tend to be lower than from the other methods. However, when comparing the individual methods, support vector machines also extrapolate on the given data while decision trees remain within the range of the provided training data. Thus, support vector machines can be more suitable for assessments where the target value shows major uncertainties. On the other side, using a classification approach and its resulting similarity metrics stabilized the Mmax estimates leading to values averaging around the other methods while geometry derived values provided the upper threshold in most cases even when not considering respective uncertainties. In total, the ensemble approach can be considered a recommended procedure when assessing uncertain seismic hazard metrics like Mmax especially in regions where the historic record is limited and can reduce the range of uncertainties.
6. Conclusion
This paper introduced an extensive analysis of subduction zone interfaces and their characteristics in light of the potential to produce large megathrust earthquakes. Beyond focussing on estimating Mmax, various correlations and relationships between Mmax and subduction zone parameters have been identified. Of those, geometry-related parameters like interface length and subduction dip lead to the highest correlation with historic maximum magnitudes. Those results also underline why using geometry-based correlation equations from various other publications as part of the ensemble assessment of Mmax. In addition, subduction zones had been analyzed to quantify their similarity to extrapolate the knowledge of well assessed subduction zones to those with limited data following the principle of trading time with space.
In summary, a tapered Gutenberg-Richter method was used to estimate return periods of megathrust earthquakes. This method accommodated both Mmax estimates and seismic moment accumulation rates including their respective uncertainties. Gutenberg-Richter parameters a and b have been calculated using a bootstrapping technique. All together, this procedure provided mean estimates and respective uncertainties for magnitude-dependent earthquake return periods.
The results highlight both well known subduction zones in regards of great megathrust earthquakes, but also regions where no such events have been observed in recent history like in Central America, the Lesser Antilles or the Philippines. These results are also supported by a significant correlation with the subduction zone parameter assessment. In addition, the results regarding the expected potential maximum magnitude were found to be in the range of previous studies.
When taking a closer look on some subduction zones, both advancement and limitations of the methodology can be seen. For example, the results for the Goringe and Horseshoe faults have been discarded of being too low and only insufficiently discretized with respect to the 1755 Lisbon earthquake. Same holds for various fault systems in and around the Pacific (e.g., Hjort, Manus, Negros Trenches) where both data and historic seismic record were insufficient to result in accountable metrics. However, subduction zone segments with limited historic record, but in the vicinity of other segments with more recent evidence of strong seismic activity like in Central America have been much better estimated and uncertainties among all applied methods remained limited.
In conclusion, both correlations and sensitivity checks provided important insight into the statistical occurrence patterns of large megathrust earthquakes regarding their occurrence probabilities and the subduction zone parameter assessment supported these findings. However, some results show a not insignificant uncertainty or a very low occurrence probability for major earthquakes. The selection of regions the global study is focussing was carefully considering which subduction zones to include and which not. For example some of the not-well studied subduction zones around Papua New Guinea and small ones like the Adriatic Thrust, the Manus and Mussau Trenches and various more are seismically not very active were not considered for further investigation. Nonetheless, almost all sources are generally considered to be capable of producing megathrust earthquake, but the probabilities differ significantly and the maximum magnitude ranges from 7.5 from 9.6 depending on the region.
For future iterations of this study, the additional subduction-related parameters can be included, but also a better representation of the seismic coupling for all subduction zones should be a key focus.
Author Contributions
AS developed the theoretical formalism and performed the statistical analysis. FW supervised and advised the project. Both authors contributed to the final version of the manuscript.
Conflict of Interest Statement
The authors declare that the research was conducted in the absence of any commercial or financial relationships that could be construed as a potential conflict of interest.
Acknowledgments
We want to acknowledge the researchers behind the data providers of the underlying databases in this study for the major efforts in collecting data and making it publicly available. We also acknowledge support by Deutsche Forschungsgemeinschaft and Open Access Publishing Fund of Karlsruhe Institute of Technology.
Supplementary Material
The Supplementary Material for this article can be found online at: https://www.frontiersin.org/articles/10.3389/feart.2019.00136/full#supplementary-material
References
Albini, P., Musson, R. M., Rovida, A., Locati, M., Gomez Capera, A. A., and Viganò, D. (2014). The global earthquake history. Earthquake Spect. 30, 607–624. doi: 10.1193/122013EQS297
Argus, D. F., Gordon, R. G., and DeMets, C. (2011). Geologically current motion of 56 plates relative to the no-net-rotation reference frame. Geochem. Geophys. Geosyst. 12. doi: 10.1029/2011GC003751
Becker, D., and Meier, T. (2010). Seismic slip deficit in the southwestern forearc of the hellenic subduction zone. Bull. Seismol. Soc. Am. 100, 325–342. doi: 10.1785/0120090156
Benford, B., DeMets, C., and Calais, E. (2012). Gps estimates of microplate motions, northern caribbean: Evidence for a hispaniola microplate and implications for earthquake hazard. Geophys.J. Int. 191, 481–490. doi: 10.1111/j.1365-246X.2012.05662.x
Bergen, K. J., Johnson, P. A., Maarten, V., and Beroza, G. C. (2019). Machine learning for data-driven discovery in solid earth geoscience. Science 363:eaau0323. doi: 10.1126/science.aau0323
Berryman, K., Wallace, L., Hayes, G., Bird, P., Wang, K., Basili, R., et al. (2015). The GEM Faulted Earth Subduction Interface Characterisation Project, Version 2.0, April 2015. Available online at: https://www.jcomm.info/index.php?option=com_oe&task=viewDocumentRecord&docID=15688 (accessed July 08, 2015).
Bird, P. (2003). An updated digital model of plate boundaries. Geochem. Geophys. Geosyst. 4:1027. doi: 10.1029/2001GC000252
Bletery, Q., Thomas, A. M., Rempel, A. W., Karlstrom, L., Sladen, A., and De Barros, L. (2016). Mega-earthquakes rupture flat megathrusts. Science 354, 1027–1031. doi: 10.1126/science.aag0482
Bungum, H., Lindholm, C., and Faleide, J. (2005). Postglacial seismicity offshore mid-norway with emphasis on spatio-temporal–magnitudal variations. Mar. Petrol. Geol. 22, 137–148. doi: 10.1016/B978-0-08-044694-3.50015-9
Clift, P., and Vannucchi, P. (2004). Controls on tectonic accretion versus erosion in subduction zones: Implications for the origin and recycling of the continental crust. Rev. Geophys. 42, 1–31. doi: 10.1029/2003RG000127
Corbi, F., Sandri, L., Bedford, J., Funiciello, F., Brizzi, S., Rosenau, M., et al. (2019). Machine learning can predict the timing and size of analog earthquakes. Geophys. Res. Lett. 46, 1303–1311. doi: 10.1029/2018GL081251
Davies, G., Griffin, J., Løvholt, F., Glimsdal, S., Harbitz, C., Thio, H. K., et al. (2017). A global probabilistic tsunami hazard assessment from earthquake sources. Geol. Soc. Lond. Spec. Publicat. 456, SP456–5. doi: 10.1144/SP456.5
DeMets, C., Gordon, R. G., and Argus, D. F. (2010). Geologically current plate motions. Geophys. J. Int. 181, 1–80. doi: 10.1111/j.1365-246X.2009.04491.x
Dziewonski, A., Chou, T.-A., and Woodhouse, J. (1981). Determination of earthquake source parameters from waveform data for studies of global and regional seismicity. J. Geophys. Res. Solid Earth 86, 2825–2852. doi: 10.1029/JB086iB04p02825
Flinn, E. A., Engdahl, E. R., and Hill, A. R. (1974). Seismic and geographical regionalization. Bull. Seismol. Soc. Am. 64, 771–992.
Gasperini, P., and Ferrari, G. (2000). Deriving numerical estimates from descriptive information: the computation of earthquake parameters. Ann. Geophys. 43, 729–746. doi: 10.4401/ag-3670
Geller, R. J., Mulargia, F., and Stark, P. B. (2015). “Why we need a new paradigm of earthquake occurrence,” in Subduction Dynamics: From Mantle Flow to Mega Disasters, eds G. Morra, D. A. Yuen, S. D. King, S. M. Lee, and S. Stein (John Wiley & Sons), 211:183.
Goda, K., Yasuda, T., Mori, N., and Maruyama, T. (2016). New scaling relationships of earthquake source parameters for stochastic tsunami simulation. Coast. Eng. J. 58:1650010. doi: 10.1142/S0578563416500108
Gutenberg, B., and Richter, C. F. (1956). Earthquake magnitude, intensity, energy, and acceleration (second paper). Bull. Seismol. Soc. Am. 46, 105–145.
Halchuk, S., Allen, T., Rogers, C. G., and Adams, J. (2015). Seismic Hazard Earthquake Epicentre File (SHEEF2010) used in the fifth generation seismic hazard maps of Canada. Natural Resources Canada.
Harrison, C. G. (2016). The present-day number of tectonic plates. Earth Planet. Space 68, 1–14. doi: 10.1186/s40623-016-0400-x
Hayes, G. P., and Furlong, K. P. (2010). Quantifying potential tsunami hazard in the puysegur subduction zone, south of new zealand. Geophys. J. Int. 183, 1512–1524. doi: 10.1111/j.1365-246X.2010.04808.x
Hayes, G. P., Moore, G. L., Portner, D. E., Hearne, M., Flamme, H., Furtney, M., et al. (2018). Slab2, a comprehensive subduction zone geometry model. Science 362, 58–61. doi: 10.1126/science.aat4723
Hayes, G. P., Wald, D. J., and Johnson, R. L. (2012). Slab1. 0: a three-dimensional model of global subduction zone geometries. J. Geophys. Res. 117:B01302. doi: 10.1029/2011JB008524
Heuret, A., Conrad, C., Funiciello, F., Lallemand, S., and Sandri, L. (2012). Relation between subduction megathrust earthquakes, trench sediment thickness and upper plate strain. Geophys. Res. Lett. 39:05304. doi: 10.1029/2011GL050712
Heuret, A., Lallemand, S., Funiciello, F., Piromallo, C., and Faccenna, C. (2011). Physical characteristics of subduction interface type seismogenic zones revisited. Geochem. Geophys. Geosyst. 12. doi: 10.1029/2010GC003230
Jarrard, R. D. (1986). Relations among subduction parameters. Rev. Geophys. 24, 217–284. doi: 10.1029/RG024i002p00217
Jarvis, A., Reuter, H. I., Nelson, A., Guevara, E., et al. (2008). Hole-filled srtm for the globe version 4.
Kagan, Y., and Jackson, D. (1994). Long-term probabilistic forecasting of earthquakes. J. Geophys. Res. 99, 13685–13700.
Kagan, Y. Y. (2002). Seismic moment distribution revisited: I. statistical results. Geophys. J. Int. 148, 520–541. doi: 10.1046/j.1365-246x.2002.01594.x
Kijko, A. (2004). Estimation of the maximum earthquake magnitude, m max. Pure Appl. Geophys. 161, 1655–1681. doi: 10.1007/s00024-004-2531-4
Kreemer, C., Blewitt, G., and Klein, E. C. (2014). A geodetic plate motion and global strain rate model. Geochem. Geophys. Geosyst. 15, 3849–3889. doi: 10.1002/2014GC005407
Lallemand, S. (2016). Philippine sea plate inception, evolution, and consumption with special emphasis on the early stages of izu-bonin-mariana subduction. Progress Earth Planet. Sci. 3:15. doi: 10.1186/s40645-016-0085-6
Lallemand, S., Heuret, A., and Boutelier, D. (2005). On the relationships between slab dip, back-arc stress, upper plate absolute motion, and crustal nature in subduction zones. Geochem. Geophys. Geosyst. 6. doi: 10.1029/2005GC000917
Lallemand, S., Peyret, M., Van Rijsingen, E., Arcay, D., and Heuret, A. (2018). Roughness characteristics of oceanic seafloor prior to subduction in relation to the seismogenic potential of subduction zones. Geochem. Geophys. Geosyst. 19, 2121–2146. doi: 10.1029/2018GC007434
Laske, G., Masters, G., Ma, Z., and Pasyanos, M. (2013). Update on crust1. 0—a 1-degree global model of earth's crust. Geophys. Res. Abstr. 15:20132658abstrEGU.
Maus, S., Barckhausen, U., Berkenbosch, H., Bournas, N., Brozena, J., Childers, V., et al. (2009). Emag2: A 2–arc min resolution earth magnetic anomaly grid compiled from satellite, airborne, and marine magnetic measurements. Geochem. Geophys. Geosyst. 10. doi: 10.1029/2009GC002471
McCaffrey, R. (2008). Global frequency of magnitude 9 earthquakes. Geology 36, 263–266. doi: 10.1130/G24402A.1
Mueller, J. E. (1968). An introduction to the hydraulic and topographic sinuosity indexes 1. Ann. Assoc. Am. Geogra. 58, 371–385.
Müller, R. D., Sdrolias, M., Gaina, C., and Roest, W. R. (2008). Age, spreading rates, and spreading asymmetry of the world's ocean crust. Geochem. Geophys. Geosyst. 9. doi: 10.1029/2007GC001743
Murotani, S., Satake, K., and Fujii, Y. (2013). Scaling relations of seismic moment, rupture area, average slip, and asperity size for m˜ 9 subduction-zone earthquakes. Geophys. Res. Lett. 40, 5070–5074. doi: 10.1002/grl.50976
Nanjo, K., Tsuruoka, H., Hirata, N., and Jordan, T. (2011). Overview of the first earthquake forecast testing experiment in japan. Earth Planets Space 63:1. doi: 10.5047/eps.2010.10.003
Nasir, A., Lenhardt, W., Hintersberger, E., and Decker, K. (2013). Assessing the completeness of historical and instrumental earthquake data in austria and the surrounding areas. Austr. J. Earth Sci. 106, 90–102.
Papazachos, B., Scordilis, E., Panagiotopoulos, D., Papazachos, C., and Karakaisis, G. (2004). Global relations between seismic fault parameters and moment magnitude of earthquakes. Bull. Geol. Soc. Greece 36, 1482–1489. doi: 10.12681/bgsg.16538
Pavlis, N. K., Holmes, S. A., Kenyon, S. C., and Factor, J. K. (2012). The development and evaluation of the earth gravitational model 2008 (egm2008). J. Geophys. Res. 117. doi: 10.1029/2011JB008916
Pedregosa, F., Varoquaux, G., Gramfort, A., Michel, V., Thirion, B., Grisel, O., et al. (2011a). Scikit-learn: machine learning in python. J. Mach. Learn. Res. 12, 2825–2830.
Pedregosa, F., Varoquaux, G., Gramfort, A., Michel, V., Thirion, B., Grisel, O., et al. (2011b). Scikit-learn: machine learning in Python. J. Mach. Learn. Res. 12, 2825–2830.
Peterson, E. T., and Seno, T. (1984). Factors affecting seismic moment release rates in subduction zones. J. Geophys. Res. 89, 10233–10248.
Rangin, C., Le Pichon, X., Mazzotti, S., Pubellier, M., Chamot-Rooke, N., Aurelio, M., Walpersdorf, A., and Quebral, R. (1999). Plate convergence measured by gps across the sundaland/philippine sea plate deformed boundary: the philippines and eastern indonesia. Geophys. J. Int. 139, 296–316. doi: 10.1046/j.1365-246x.1999.00969.x
Rong, Y., Jackson, D. D., Magistrale, H., and Goldfinger, C. (2014). Magnitude limits of subduction zone earthquakes. Bull. Seismol. Soc. Am. 104, 2359–2377. doi: 10.1785/0120130287
A. Rovida, M. Locati, R. Camassi, B. Lolli, and P. Gasperini (eds.). (2016). CPTI15, the 2015 Version of the Parametric Catalogue of Italian Earthquakes. Istituto Nazionale di Geofisica e Vulcanologia. doi: 10.6092/INGV.IT-CPTI15
Ruff, L., and Kanamori, H. (1980). Seismicity and the subduction process. Phys. Earth Planet. Inter. 23, 240–252.
Schellart, W., and Rawlinson, N. (2013). Global correlations between maximum magnitudes of subduction zone interface thrust earthquakes and physical parameters of subduction zones. Phys. Earth. Planet. Inter. 225, 41–67. doi: 10.1016/j.pepi.2013.10.001
Scholz, C. H., and Campos, J. (2012). The seismic coupling of subduction zones revisited. J. Geophys. Res. 117. doi: 10.1029/2011JB009003
Shebalin, N., and Leydecker, G. (1997). Earthquake Catalogue for the Former Soviet Union and Borders up to 1988. Luxembourg: Office for Official Publications of the European Communities, Luxembourg, 135.
Skarlatoudis, A., Somerville, P., and Thio, H. (2016). Source-scaling relations of interface subduction earthquakes for strong ground motion and tsunami simulation. Bull. Seismol. Soc. Am. 106, 1652–1662. doi: 10.1785/0120150320
Stein, S., and Okal, E. A. (2007). Ultralong period seismic study of the december 2004 indian ocean earthquake and implications for regional tectonics and the subduction process. Bull. Seismol. Soc. Am. 97, S279–S295. doi: 10.1785/0120050617
Storchak, D. A., Di Giacomo, D., Bondár, I., Engdahl, E. R., Harris, J., Lee, W. H., et al. (2013). Public release of the isc–gem global instrumental earthquake catalogue (1900–2009). Seismol. Res. Lett. 84, 810–815. doi: 10.1785/0220130034
Suárez, G., and Albini, P. (2009). Evidence for great tsunamigenic earthquakes (m 8.6) along the mexican subduction zone. Bull. Seismol. Soc. Am. 99, 892–896. doi: 10.1785/0120080201
Symithe, S., Calais, E., Chabalier, J., Robertson, R., and Higgins, M. (2015). Current block motions and strain accumulation on active faults in the caribbean. J. Geophys. Res. 120, 3748–3774. doi: 10.1002/2014JB011779
Thingbaijam, K. K. S., Martin Mai, P., and Goda, K. (2017). New empirical earthquake source-scaling laws. Bull. Seismol. Soc. Am. 107, 2225–2246. doi: 10.1785/0120170017
Van Rijsingen, E., Lallemand, S., Peyret, M., Arcay, D., Heuret, A., Funiciello, F., and Corbi, F. (2018). How subduction interface roughness influences the occurrence of large interplate earthquakes. Geochem. Geophys. Geosyst. 19, 2342–2370. doi: 10.1029/2018GC007618
Walters, P. (2000). An Introduction to Ergodic Theory, Vol 79. Berkeley, CA: Springer Science & Business Media.
Wells, D. L., and Coppersmith, K. J. (1994). New empirical relationships among magnitude, rupture length, rupture width, rupture area, and surface displacement. Bull. Seismol. Soc. Am. 84, 974–1002.
Keywords: megathrust, hazard, global, maximum magnitude, earthquake, tsunami
Citation: Schäfer AM and Wenzel F (2019) Global Megathrust Earthquake Hazard—Maximum Magnitude Assessment Using Multi-Variate Machine Learning. Front. Earth Sci. 7:136. doi: 10.3389/feart.2019.00136
Received: 17 December 2018; Accepted: 15 May 2019;
Published: 04 June 2019.
Edited by:
Conrad Daniel Lindholm, Norsar, NorwayReviewed by:
Kiran Kumar Singh Thingbaijam, Institute of Seismological Research, IndiaQuentin Bletery, UMR7329 Géoazur (GEOAZUR), France
Copyright © 2019 Schäfer and Wenzel. This is an open-access article distributed under the terms of the Creative Commons Attribution License (CC BY). The use, distribution or reproduction in other forums is permitted, provided the original author(s) and the copyright owner(s) are credited and that the original publication in this journal is cited, in accordance with accepted academic practice. No use, distribution or reproduction is permitted which does not comply with these terms.
*Correspondence: Andreas M. Schäfer, andreas.schaefer@kit.edu